How Alternative Data Can Transform Your Business Intelligence

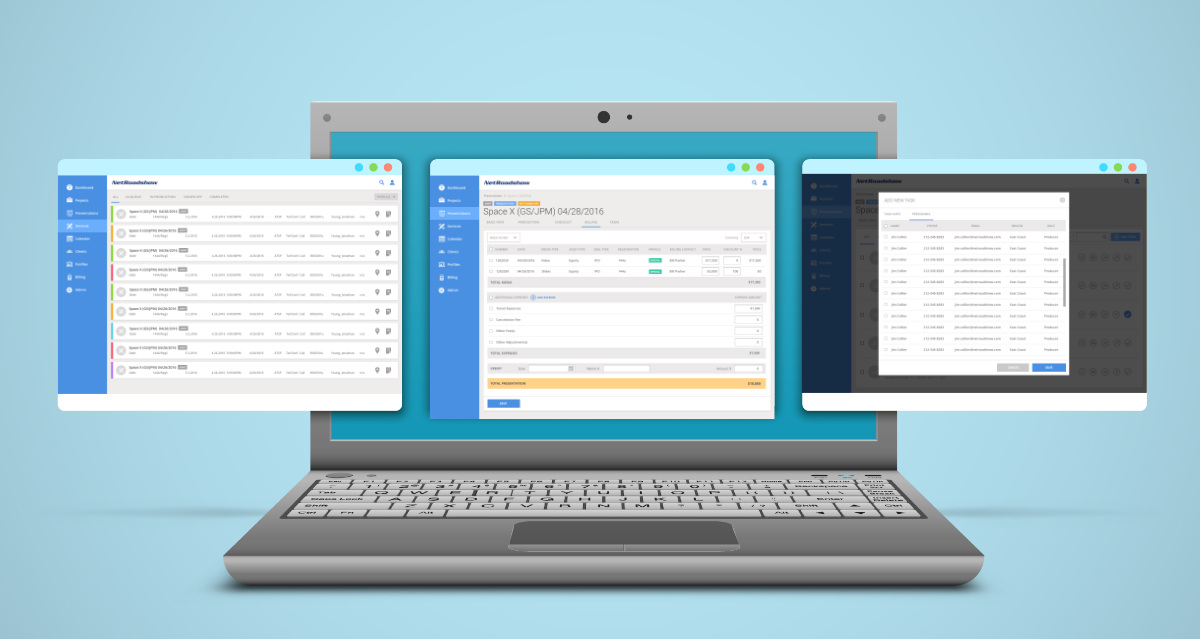
EDITOR’S NOTE: This article is about harnessing new sources of Alternative Data. True Interaction built SYNAPTIK, our Data Management, Analytics, and Machine Learning Platform, specifically to make it easy to collect and manage core and alternative data/media types for more meaningful data discovery. For more information or a demo, please visit us at https://synaptik.co/ or email us at hello@www.true.design

Big data has been commonly described over the last few years through properties known as the “3 V’s”: Volume, Velocity, and Variety. If you are a human being just about anywhere in the world today, it’s patently obvious to you that these three dimensions are increasing at an exponential rate.

We’ve seen the staggering statistics with regards to Volume and Velocity reported and discussed everywhere:

Big Volume
IDC reported that the data we collectively create and copy globally is doubling in size every two years. Calculated at 4.4 zettabytes in 2014, the organization estimates global data will reach 44 zettabytes — that’s 44 trillion gigabytes — by 2020.
Cisco forecasts that overall mobile data traffic is expected to grow to 49 exabytes per month by 2021, a seven-fold increase over 2016. Mobile data traffic will grow at a compound annual growth rate (CAGR) of 47 percent from 2016 to 2021.

Big Velocity

Facebook’s 1.97 billion monthly active users send an average of 31.25 million messages and view 2.77 million videos every minute.

Twitter’s 308 million monthly active users send, on average, around 6,000 tweets every second. This corresponds to over 350,000 tweets sent per minute, 500 million tweets per day and around 200 billion tweets per year.

Big Variety = Alternative, Non-traditional, Orthogonal Data

These well-touted figures often leave one feeling aghast, small, and perhaps powerless. Don’t worry, the feeling is mutual! So today, let’s get ourselves right-sized again, and shift our focus to the 3rd dimension — of big data, that is — and examine a growing, more optimistic, and actionable business trend concerning big data that is materializing in organizations and businesses of all kinds, across just about any industry that you can imagine, without regard for business size or scope. Let’s examine the explosion of big data Variety, specifically with regards to harnessing new and emerging varieties of data to further inform reporting, forecasting, and the provision of actionable BI insights.

In a pattern similar to online retail’s “Long Tail” — the emphasis of niche products to consumers providing that emerged in the 2000’s — more and more future-leaning businesses are incorporating outside, alternate “niches” of data that differ from the traditional BI data sources that standard BI dashboards have commonly provided.

In a recent interview in CIO, Krishna Nathan, CIO of S&P Global explained that “Some companies are starting to collect data known as alternative, non-traditional or orthogonal.” Nathan further describes Alternative Data as the various data “that draw from non-traditional data sources, so that when you apply analytics to the data, they yield additional insights that complement the information you receive from traditional sources.” Because of the increasing prevalence of data from mobile devices, satellites, IoT sensors and applications, huge quantities of structured, semi-structured and unstructured data have the potential to be mined for information and potentially help people make better data-driven decisions. “While it is still early days for this new kind of data”, Nathan says, “CIOs should start to become familiar with the technologies now. Soon enough, alternative data will be table stakes.”

In The Field

Let’s examine the various applications of these new data sources that are manifesting themselves in parallel with the burgeoning technological advancements in our world today.

VC and Credit

Alternative data is increasingly wielded by VC firms as well as the credit industry to lend insight into backing startups, businesses, and technologies. Many small businesses, especially those with a limited credit history, have difficulty demonstrating creditworthiness and may be deemed as high risk when viewed through the lens of traditional data sources.

However, Experian recently described the growing number number of online marketplace lenders, or nonbank lenders, that have already begun taking a nontraditional approach by leveraging a wealth of alternative data sources, such as social media, Web traffic, or app downloads to help fill the void that a business with limited credit history might have. By combining both traditional and nontraditional data sets, these lenders are able to help small businesses access financial resources, while expanding their own portfolios.

Health

Patient information continues to be collected through traditional public health data sources, including hospital administration departments, health surveys and clinical trials. Data analysis of these sources is slow, costly, limited by responder bias, and fragmented.

However, According to MaRS DD, a research and science-based entrepreneurial venture firm, with the growing use of personal health applications among the public, self-reported information on prescription drug consumption and nutritional intake can be analyzed and leveraged to gain insight into patient compliance and use patterns, as well as into chronic disease management aptitude in between visits to frontline healthcare practitioners. In addition, social media platforms can be used as both monitoring tools and non-traditional methods of increasing patient engagement, as they allow healthcare professionals to interact with populations that under-utilize services. Healthcare organizations can mine social media for specific keywords to focus and project initiatives that track the spread of influenza, zika, or opioid addiction, for example, or even to provide real-time intervention.

Retail, Dining, Hospitality and Events

Several different kinds of data sources can give these industries a bigger picture and aid in both more granular reporting, but also more accurate forecasting. For example, Foursquare famously predicted that Chipotle same-store sales would fall 29 percent after the Mexican chain was hit with E. coli outbreaks, based upon check-ins on their application. The actual decline announced by Chipotle ended up being a spot-on 30 percent. It’s no coincidence that Foursquare recently announced Foursquare Analytics, a foot traffic dashboard for brands and retailers.

In addition, by making use of CCTV or drone imagery, incredible insight can be garnered from examining in-store foot traffic or the density of vehicles in a retailer’s parking lot over time. Today, a combination of Wi-Fi hotspots and CCTV cameras can compile numbers about in-store customer traffic patterns in the same way that online stores collect visitor and click information. For example, by using a modern CCTV system to count the number of people in each part of the store, heatmap analytics can visualize “hot zones” — to help maximize in-store promotional campaigns, and identify “cold zones” to determine how store layout changes can improve customer traffic flow.

Don’t forget the weather! By leveraging a real-time weather data analytics system in order to process historical, current, and forecasted weather data, retailers can predict how shifting demands will affect inventory, merchandising, marketing, staffing, logistics, and more.

Wall Street

You can bet your life that investment firms are early adopters of alternative data sources such as in the Chipotle-Foursquare story mentioned earlier. Consider the incredible resource that satellite imagery is becoming — it’s not just for government intelligence anymore: Because satellite imagery now enables organizations to count cars in retailers’ parking lots, it is possible to estimate quarterly earnings ahead of a business’ quarterly reports. Data analysts can use simple trigonometry to measure the shadows cast by floating oil tank lids in order to gauge the world’s oil supply. By monitoring vehicles coming and going from industrial facilities in China, it’s even possible to create a nascent China manufacturing index. Infrared sensors combined with satellite images can detect crop health far ahead of the USDA. All of this makes a boon for traders and investors.

What About Your Organization?

No matter the size of your business, now is the time to consider upgrading your 2000’s-era BI Dashboards to incorporate alternative data sources — remember, the convergence of IoT, cloud, and big data are creating new opportunities for analytics all the time. Data is expected to double every two years, for the next decade. Furthermore, it is essential to integrate all of these data opportunities with traditional data sources in order to create a full spectrum of analytics, and drive more intelligent, more actionable insights.

The Right Analytics Platform

Legacy data management systems that have not optimized their operations will not be able to process these new and disparate sources of alternative data to produce relevant information in a timely manner. The lack of machine learning mechanisms within these sub-optimal systems will hinder businesses in their knowledge discovery process, barring organizations from making data-driven decisions in real time.

According to Joe Sticca, Senior Executive of Digital Transformation & Data Science for True Interaction, “The most deleterious disadvantage of failing to address these pressing issues… is the careless neglect of invaluable business insight that is concealed in the mass of available data. Now, more than ever, businesses of all size need the ability to do great data discovery, but without necessitating a deep core technical development and data analyst skillset to do so.”

One solution path? Cutting-edge fully-managed data and machine learning platforms like Synaptik, that make it easy to connect with dozens of both structured and unstructured data services and sources, in order to gain the power of algorithms, statistical analysis, predictive modeling and machine learning, for a multitude of purposes, and metrics such as brand sentiment, campaign effectiveness and customer experience. Synaptik helps businesses transform via an adaptive, intuitive and accessible platform – using a modern mix of lightweight frameworks, scalable cloud services, and effective data management and research tools. More importantly, it works with non-IT skill sets to propagate better pattern recognition across your organization’s people and divisions.

(infographic by Quandl.com)

by Michael Davison

Need a Website?
Fast!

We ship you a revenue-ready store in less than 24hrs and handle everything from product to customer service.

Need Help with Your Website?

We'll review your project and assign it to the correct team. Don't worry, we have teams for all budgets.

Teams that Innovate

Have a brilliant idea and looking to innovate and start something new? We have a variety of teams to choose from, who can help you design and build.

A History of Success

Need an Agency with a track record? Take a look at our past work to see how our teams have built some of the best business-critical enterprise-grade tools.