💡 Enterprise Automation Experts | Est. 2002
True Interaction is a boutique consultancy specializing in high-performance automation and AI systems for enterprise environments – transforming operations in finance, insurance, claims, logistics, CX, and manufacturing.
Start Your Strategy CallExpertise that drives transformation
Migrating enterprise systems securely and efficiently to cloud environments.
Designing scalable and resilient digital infrastructure for growth.
Upgrading legacy platforms and accelerating time to value.
Optimizing third-party partnerships to maximize ROI and reduce risk.
Ensuring enterprise-grade security, governance, and regulatory alignment.
Private AI for enterprise data — secure, compliant, and deployable inside regulated systems.
Explore SLPNRIntegrate and extend HubSpot with custom workflows, data sync, and intelligent reporting.
HubSpot SolutionsArchitect, optimize, and secure cloud infrastructure using scalable, cost-effective AWS stacks.
AWS ServicesExperience across industries and organizational layers
“45% cost reduction” • “2x faster deployment” • “10,000+ users scaled” • “Weeks ahead of schedule” • “Global rollout across 3 continents” • “System uptime 99.99%+” • “Cross-department integration in 60 days” • “+300% traffic growth” • “End-to-end automation of legacy workflows”StoneRidge, RXSense, Exiger, NoFraud, Lifetime Brands, NetRoadShow, Magnet360, Wittman Battenfeld, SAP, GSK, Lilly, Otsuka, MetLife
HAVAS, Universal McCann, McCann Worldgroup, JWT, Y&R, FCB, Ogilvy & Mather, Initiative, Curiosity, Beker, Primer, Anonimo, 20th Century Fox, Ache Producciones, Herrero, Grupo Ferrer, Proenza, Farmer & Co., Reprise Media
Northeastern University, SAP University Alliances, Ipsos
Montford Point Marine Association (USMC), Girls Inc., Vatican Foundation (CAPP), Golden Key Honor Society
We drive our customers needs forward with expertise and care

Global integration of cloud-based applications, APIs, CRMs, and ERPs to reduce overhead and improve customer engagement.
“They're a vital partner in our innovation initiatives... co-designing scalable solutions that power multiple facets of our business.” – Pinto, L., Cloud Development
“True Interaction has made a measurable impact... Liam not only writes great code, but drives real operational value.” – Dodson, J., Logistics
“I could not have asked for a better experience. The data is now streamlined and organized.” – Spayde, J., Claims Management
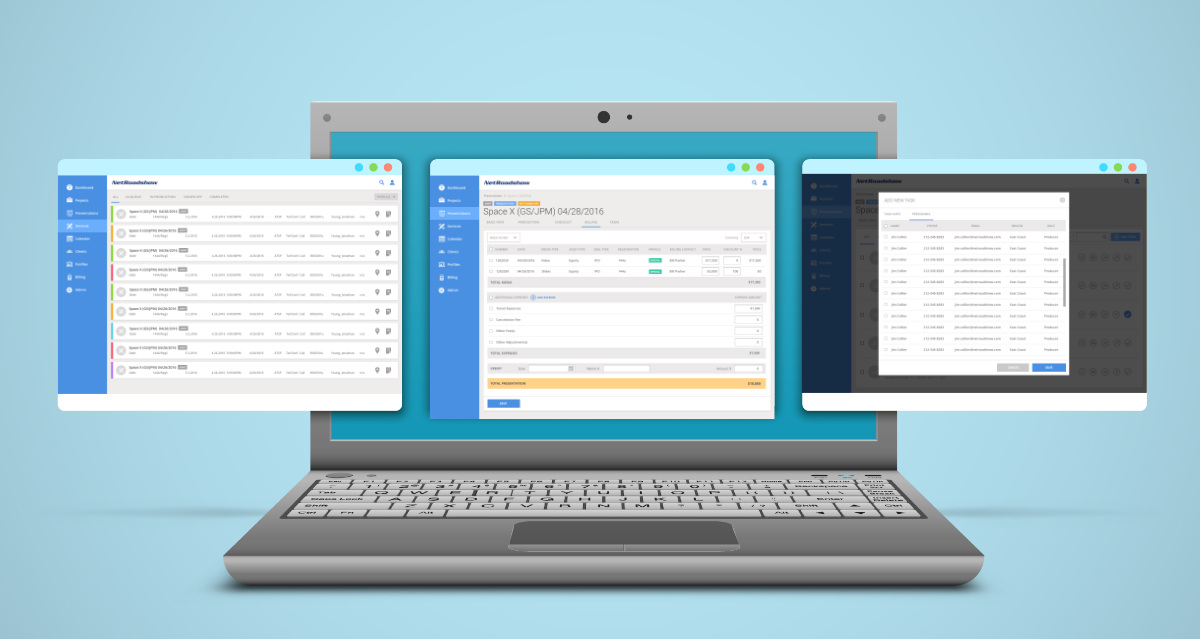
Modernized SEC-compliant investment platform through Salesforce and accounting software integrations.
“Fast, accurate, and just what we needed.”
“True Interaction truly understood what our needs were better than any other company.” – Mary H., SVP
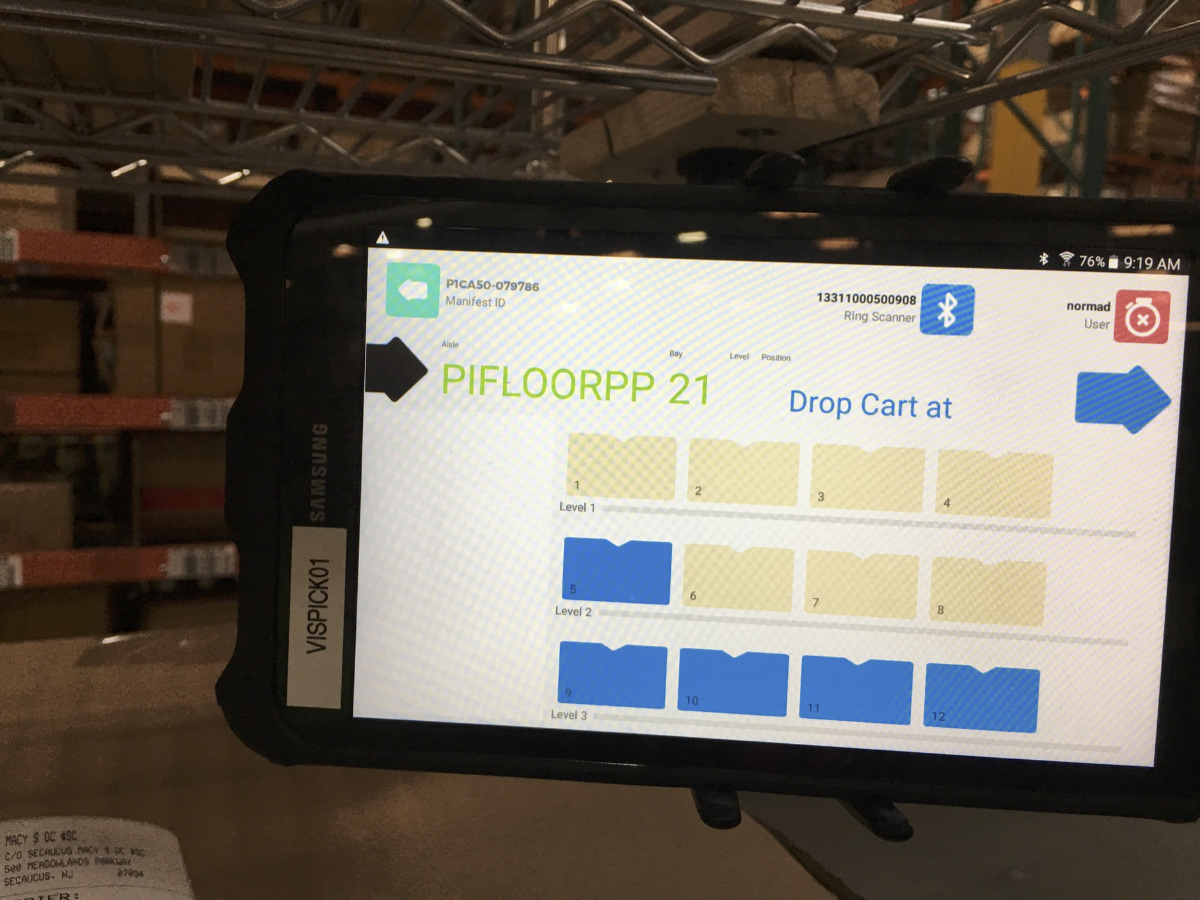
Long-term innovation partner across QA, Supply Chain, and Customer Experience.
“So intuitive and fast they’ve been described as artists.” – Cliff S., EVP, Supply Chain
“They were able to address [new needs] very quickly, and develop a solution almost instantaneously. It was amazing.” – Sarah S., General Counsel
“We don’t just deliver software. We become your thought partner.
That’s why our clients stay with us — some for 7+ years.”
— O. Liam Wright, Founder, True Interaction
Let’s align your vision with technology that works. Share your details and we’ll connect.